Every year, high school programs send out a fixed number of offers to fill seats for the following school year. Program applicants are placed on a ranked list and offers are sent to those applicants in order of rank. The point at which the worst ranked applicant was sent an offer is considered the “cutoff”.
For programs with “Open” or “Ed. Opt.” admission methods, lottery numbers weigh heavily in those rankings. The best lottery number starts with a “#00” and the worst starts with an “#FF”. This is a hexadecimal number that ranges from 0 to 255. Programs with a “Screened” admission method rank applicants by “group” (which is based on the average of their final 7th grade core course grades) and lottery number. This is slightly different from programs with a “Screened with assessment” admission method, which also takes into account a program-specific screening requirement, such as an essay.
NYC-SIFT only creates cutoff estimates & predictions for programs with “Open”, “Ed. Opt.”, or “Screened” admissions.
Open Programs
First, let’s consider “Open” programs. For these programs, an applicant’s lottery number is the only determining factor for ranking.
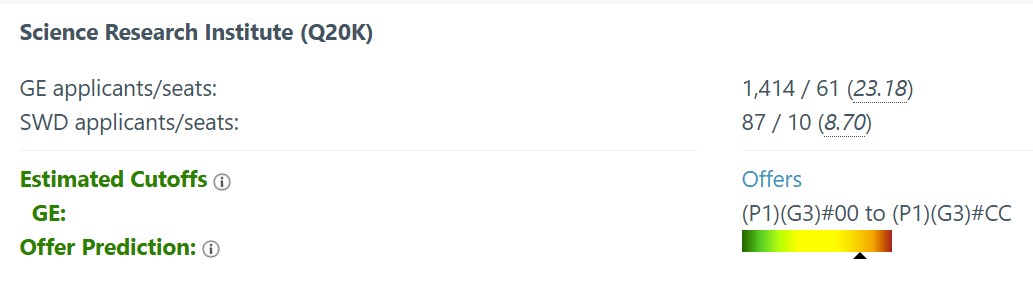
Currently, the DOE provides the number of applicants and seats available for each program. On average, programs send out offers that equal to about 150% of available seats. By default, NYC-SIFT assumes the lottery number distribution of the applicant pool is equal, meaning that there are just as many applicants with lottery numbers that start with “00” as they do with any other lottery number.
Open Program example
Using this information, let’s say we have an “Open” program that had 1,000 applicants and 100 seats. 150 offers are assumed to have been sent to the top 150 ranked applicants. The worst ranked applicant that was sent an offer should have a lottery number whose decimal value was 38 (150 / 1,000 * 255). Converting this number to a hexadecimal value would get you “#26”. This means the estimated cutoff for this program is a lottery number that started with “#26”.
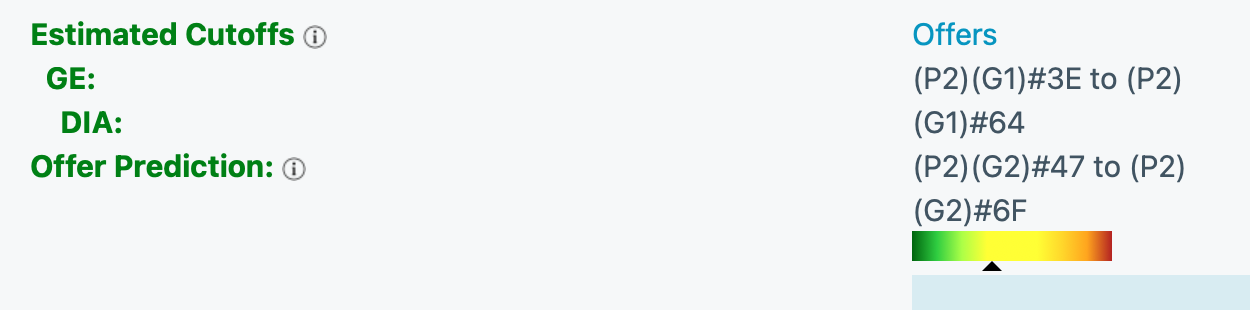
We should expect a degree of error with this calculation due to the unknown distribution of lottery numbers and the fact that we are trying to use this information to predict the future. With this in mind, NYC-SIFT creates a lower and upper bound to the cutoff by subtracting and adding a hexadecimal value to the cutoff (equating to a 12.5% band). This means the estimated cutoff range will be displayed on NYC-SIFT as: “#16” to “#36”.
NYC-SIFT’s color-coded prediction band ranges from green to red. Internally, the color band is divided into 8 sections. Now imagine a line with 9 evenly spaced vertical markings, with mark 1 representing 0 and mark 9 representing 1,000 (the maxmimum number of applicants). Mark 4 would represent 22 (lower bound decimal value of hex value “#16”), mark 5 would represent 38 (the decimal value of the cutoff), and mark 6 would represent 56 (upper bound decimal value of hex value “#36”). Marks 2 and 3 would be equally spaced apart with values of 7 and 14, respectively. Marks 7 and 8 would also be equally spaced apart with values of 370 and 684, respectively.
Putting this all together, there is now a line with the following markings: 0, 7, 14, 22, 38, 56, 370, 684, and 1,000. On the color band, any value between 0 and 7 will point to dark green. Values between 7 and 14 will be green. Values between 14 and 22 will be light green. Values between 22 and 56 will be yellow. Values between 56 and 370 will be dark yellow. Values between 370 and 684 will be orange. Values between 684 and 1,000 will be red.
As you can see, we have now generated a graded colored ranking system for this program. Let’s say your lottery number starts with “#36” (which happens to be at the top of the estimated cutoff). Converting this into a decimal number gets us 54. Now we convert this number into our program rank, which is 211 (54 / 255 * 1,000). This would place us between marks 6 and 7, which is dark yellow. If your lottery number started with a “#05”, the converted program rank would be 19 (5 / 255 * 1,000), which is light green.
You’ll notice that that the conversions to color make it so that a very narrow set of applicants will get dark green, while the largest set of applicants will get yellow to dark yellow. This is intentional, as the system is doing its best to err on the side of caution. Any offer prediction value that lands you in dark yellow / light orange or better should be considered as a positive one. That being said, you may want to include at least one program where you are solid yellow or better for safety purposes.
Screened Programs
Screened programs differ in that applicants are placed into one of four groups based on 7th grade course grades. By default, NYC-SIFT assumes the group distribution of the applicant pool is equal, meaning that there are just as many applicants in Group 1 as they do with any other group.
Screened Program Example
Let’s say we have an “Screened” program that had 1,000 applicants and 100 seats. 150 offers are assumed to have been sent to the top 150 ranked applicants. With five screened groups (200 applicants per group), the worst ranked applicant that was sent an offer should be in Group 1 and have a lottery number whose decimal value was 191 (150 / 200 * 255). Converting this number to a hexadecimal value would get you “#BF”. This means the estimated cutoff for this program is a lottery number that started with “#BF”.
NYC-SIFT creates a lower and upper bound to the cutoff by subtracting and adding a hexadecimal value to the cutoff (equating to a 12.5% band within the group). This means the estimated cutoff range will be displayed on NYC-SIFT as: “(G1)#AF” to “(G1)#CF”. Since the applicant pool and offers are the same as the “Open Program Example”, the colored ranking system is also the same with the following markings: 0, 7, 14, 22, 38, 56, 370, 684, and 1,000.
The only difference now is including your screened program group as part of the conversion to the program rank.
Ed. Opt. Programs
Applicants are placed into one of three groups based on 7th grade course grades. Programs reserve 1/3 of all seats for each group. Since there are no factors other than lottery number that affect applicant ranking, calculations for “Ed. Opt.” programs are the same as “Open” programs.
Closing Remarks
There are also borough and DIA considerations that are used to calculate rankings, but I won’t be going into those details at this time. Hopefully this explanation was clear enough to shed some light on the inner workings of NYC-SIFT’s newest feature!